Redistribution may be defined as the transfer of tax revenue to finance the state apparatus and maintain the government. One of the ways to calculate the size of redistribution of an economy is to calculate the ratio between tax revenue and the gross domestic product (GDP). This indicator is used by the Eurostat and various international organizations, such as OECD, the World Bank, etc. Some economists even use this as a proxy indicator for tax burden. Many agree that high values of tax revenue-to-GDP signal high level of redistribution. New Member States are often berated for having relatively low levels of redistribution and these statistics are presented as alleged successes or presumed failures of supposed liberal economic policies by the new Member States.
Regardless of the efficacy of tax revenue-to-GDP indicator, it seems that statistics are biased against new Member States. Our research proposes that the tax revenue-to-GDP indicator is biased against countries which do not tax transfer payments, have higher shadow economies, and lower sovereign debt. If adjusted to reflect these differences, the tax revenue-to-GDP indicator does not show significant differences between old and new Member States. This challenges the claim that new Member States redistribute to little or that they should redistribute more.
The calculations of the adjusted indicator show that if different factors (taxation of social security contributions, size of official non-observed economy during the year) were assessed, the maximum rate of redistribution in Lithuania could reach 34.2 percent of GDP (4.8 percent higher compared to Eurostat estimated size of 29.4 percent of GDP in 2015). The average size of redistribution in the EU would be 40.8 percent of GDP (0.8 percent higher than the current rate of 40 percent of GDP).

Factors that influence the indicator of redistribution
– Taxation of social security contributions
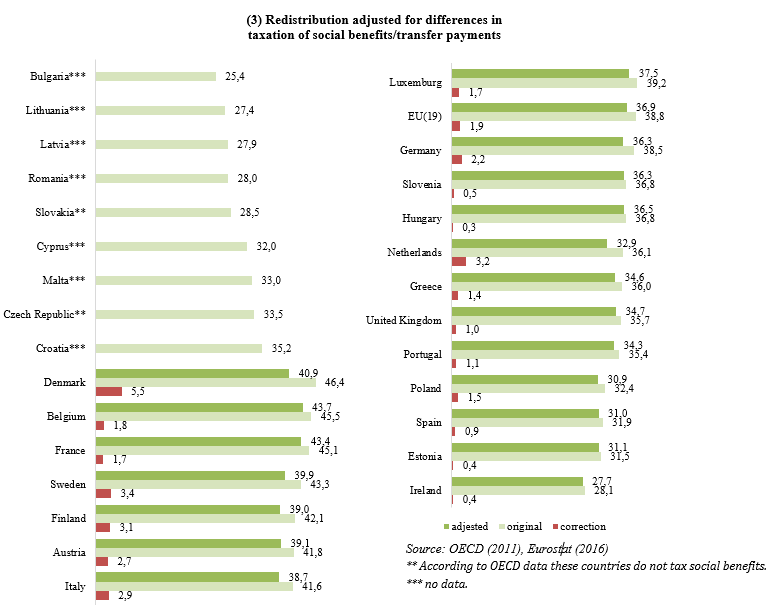
In many countries social security contributions are taxed. If revenue from taxing social security contributions are treated as tax revenue and if social benefits primarily come from public sources, there is a possibility that redistribution statistics are skewed. More precisely, countries that tax social security contributions might seem to have more tax revenue than those which do not tax social security contributions or transfer payments.
According to OECD data, countries that tax security contributions collect a part of their revenue through those taxes. In different countries the part of tax revenue derived from taxes on social security contributions ranges from 0.3 to 5.5 percent of GDP. Almost all EU countries impose taxes on social security contributions. As a result, those countries seem to redistribute more. The adjusted sizes of redistribution (with regard to taxation of social security contributions) based on the below formula are provided in Figure 3.


– The size of the shadow economy (tax non-collection)
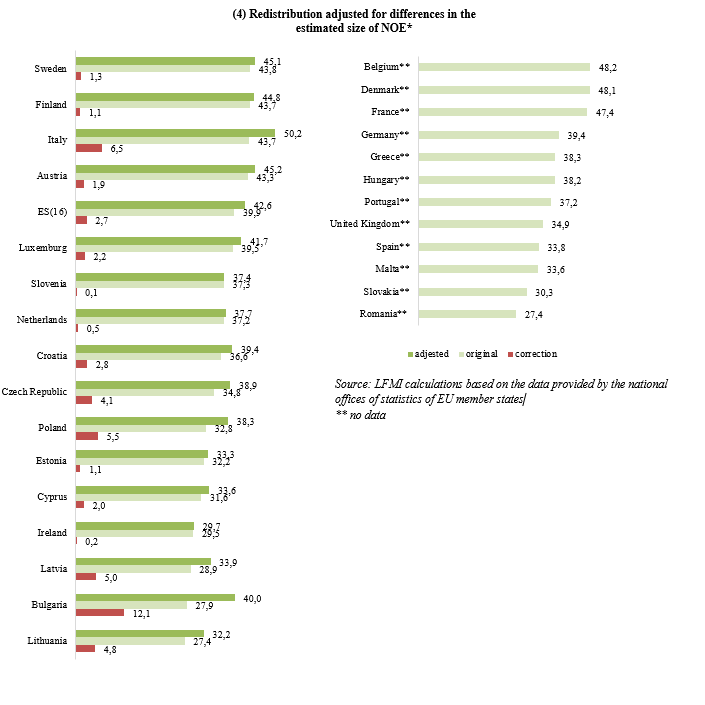
Calculations of the indicator of redistribution (the ratio between tax revenue and GDP) should assess the shadow (non-observed) economy. Differences in values of non-observed economy (NOE) in the GDP calculation may significantly distort the tax revenue-to-GDP statistics.
The estimate of non-observed economy (NOE) is included in GDP calculations, but the data on tax revenue only reflects the actual tax revenue. The higher the estimate for NOE is used in GDP calculations, the larger the denominator, the lower the indicator of redistribution.
The impact of non-observed economy on redistribution is assessed based on the formula below. Results are presented in Figure 4.

 To account for non-observed economy, we have to adjust Lithuania’s redistribution indicator by 4.8 percent (up to 32.2 percent of GDP). If Member States include the shadow economy in their official GDP statistics, the average size of redistribution in the EU would account for 40.8 percent of GDP as compared to the current Eurostat estimate of 40 percent.
The full analysis (in Lithuanian) is available at http://www.llri.lt/naujienos/ekonomine-politika/25539/lrinka
LFMI’s previous analysis and a paper on redistribution of intra-budgetary funds across Lithuanian municipalities (in English) is available at http://en.llri.lt/news/economic-policy/redistribution-of-intra-budgetary-funds-across-municipalities/lrinka