The Costs of Maintaining the Bureaucratic Apparatus
A cross country analysis of government expenditure on general public services in Lithuania, Poland, Slovakia and Bulgaria
Governments spend financial resources on various functions ranging from healthcare to social protection to education to defence and others. Inevitably, a part of public finance is allocated to the functioning of the bureaucratic system because general public services, including the administration of public authorities, remuneration for MPs and their staff, holding public elections, auditing, etc. are necessary for other public services to exist.
Measuring the efficiency of the bureaucratic system is very complicated because there are no tangible outputs that could be evaluated. For example, there are no objective criteria for evaluating the performance of MPs; however, a cross-country analysis of government spending on general public services provides some useful information by showing which countries spend more and how the price of government in similar countries differs.
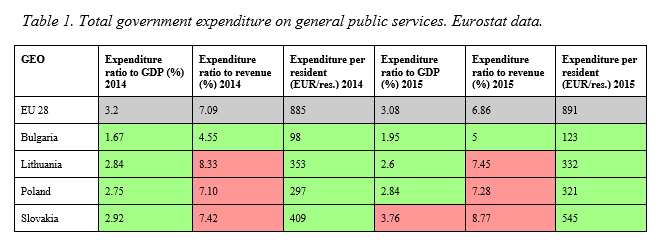
This article offers an assessment and comparison of government spending on general public services in Lithuania, Poland, Slovakia and Bulgaria. The overall results show that, although these countries, except Slovakia, spent relatively less (compared to GDP and public revenue) on general public services than EU 28, spending on executive and legislative organs, financial and fiscal affairs, and external affairs was above the EU 28 average in 2015.
In 2014 all countries had a lower expenditure to GDP ratio on general public services than EU 28. The situation was different in 2015 when government expenditure in Slovakia exceeded the EU 28 average as regards the ratio to GDP. Compared to revenue, expenditure exceeded the average in all the countries except Bulgaria (Table 1).
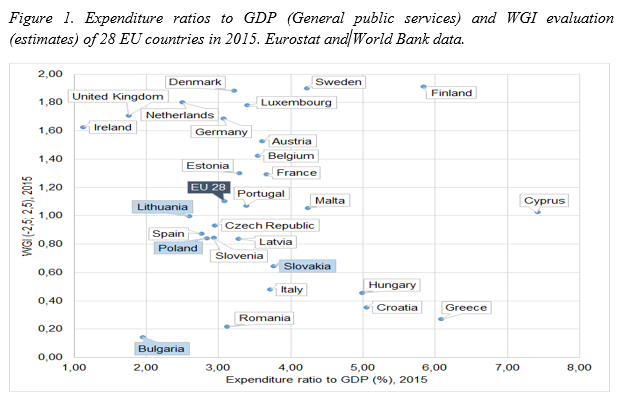
In 2015 the estimate values of the World Bank’s World Governance Indicators (WGI) were 0.14 for Bulgaria, 1 for Lithuania, 0.84 for Poland and 0.64 for Slovakia, and the efficiency indices were 0.07, 0.38, 0.3 and 0.17, respectively. Bulgaria was thus estimated to be the most inefficient country in terms of general public services.
Figure 1 below illustrates the distribution of 28 EU countries according to the expenditure to GDP ratio (for general public services) and WGI estimates. Results show that in 2015 Slovakia spent more than the average on general public services, while other countries spent less. However, all of the analysed countries received a lower score than the WGI average. It can thus be concluded that there is no connection between spending on general public services and a higher evaluation received by the government.
A more detailed analysis of expenditure on general public services points to potentially inefficient spending on executive and legislative organs, financial and fiscal affairs as well as external affairs, the sub-group which has the highest share among the evaluated expenditure sub-groups.
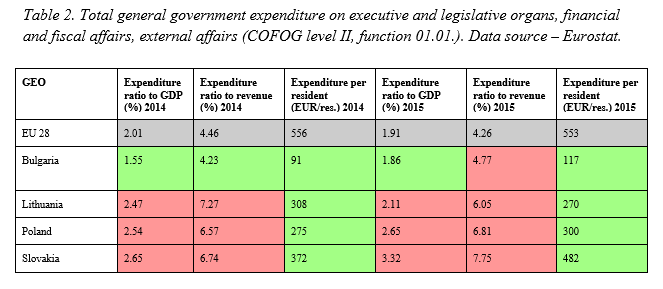
In 2014 and 2015 the four countries under analysis spent a lower amount per resident for executive and legislative organs, financial and fiscal affairs and external affairs than EU 28. However, this occurred because of the generally lower GDP per capita – these countries could afford less nominally. Indeed, the ratios of expenditure to GDP and revenue prove that expenditure on this sub-group is higher than EU 28 and therefore might be inefficient.
In 2015, Lithuania, Poland and Slovakia spent more than the average as a ratio to GDP. Compared to 2014, in 2015 Bulgaria, Poland and Slovakia spent more, whereas Lithuania spent less (Table 2).
In 2015, Slovakia had the highest ratios of expenditure to GDP and revenue in the said sub-group. Poland and Lithuania had higher ratios than the average, whereas Bulgaria had the lowest ratio (Table 2).
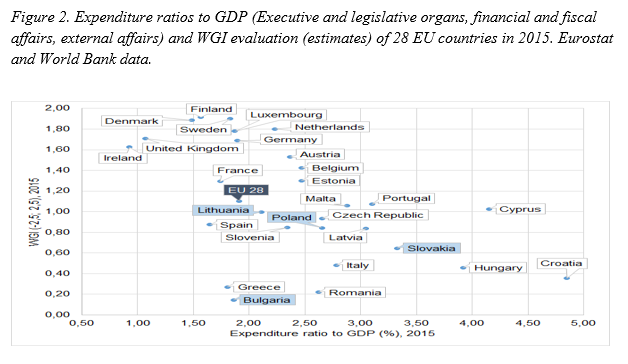
Compared to the outcome indicators of WGI, Bulgaria showed the lowest value, where the ratio of WGI to expenditure/GDP was 0.08. Poland scored 0.32, Slovakia, 0.19, and Lithuania, 0.47, which represented the best result from among the analysed countries.
Figure 2 illustrates the distribution of 28 EU countries according to the expenditure to GDP ratio (executive and legislative organs, financial and fiscal affairs, external affairs) and WGI. The analysis shows that in 2015 all the countries spent more than the average on executive and legislative organs, financial and fiscal affairs, as well as external affairs, except Bulgaria which slightly below the average. And all the countries received a lower WGI score than the average. This analysis also shows that EU countries that spent more on executive and legislative organs, financial and fiscal affairs, as well as external affairs had a lower WGI score.
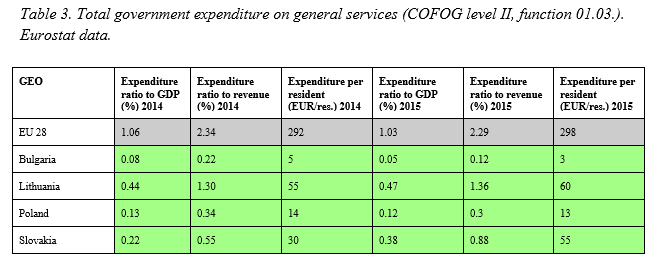
Further analysis shows that in 2014 and 2015 government expenditure on general personnel public services in the four countries under analysis was lower than EU 28. This group is mostly concerned with expenses for general personnel services and other services undertaken by central offices (for example, centralised databases).
Among the four countries, Lithuania spent most on this sub-group. Compared to Bulgaria which spent the least amount per resident, Lithuania spent almost 20 times as much in 2015.
Compared to 2014, Bulgaria and Poland reduced their expenditure levels in 2015. In contrast, Lithuania and Slovakia increased spending in this sub-group (Table 3).
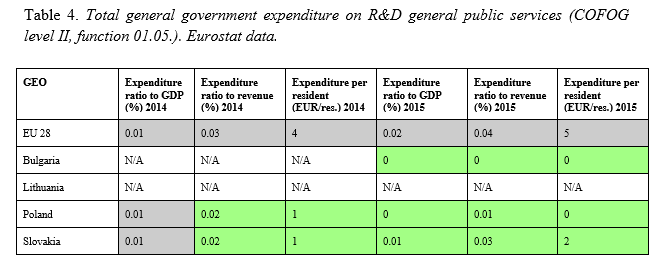
Analysis of expenditure on R&D general public services shows that spending on this sub-group is insignificant (the EU 28 average was 4 to 5 euros per resident per year in 2014 and 2015). In 2015, Bulgaria reported no spending on this sub-group, while Poland and Slovakia had negligible expenditure. There is no data on this sub-group for Lithuania (Table 4).
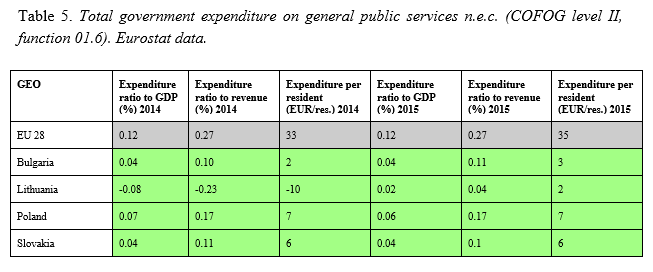
Finally, the last sub-group in the analysis – general public services n.e.c. – represents any expenditure that cannot be assigned to any other sub-group. For example, expenditure on holding elections and referendums, registration of voters, administration of trust territories, etc. All the countries spent less than the EU 28 average on this sub-group in 2014 and 2015. The amount per resident fluctuated from 2 to 7 euros among the analysed countries in 2015 (Table 5).
Conclusions
Analysis shows that, even though Lithuania, Poland and Bulgaria spent relatively less on general public services (foreign economic aid, basic research, public debt transactions and transfers of a general character between different levels of government excluded) than EU 28, spending on executive and legislative organs, financial and fiscal affairs as well as external affairs was above average in 2015.
Outcome analysis (the World Governance Indicators ratio to expenditure/GDP) shows that the lowest efficiency among the analysed countries in 2015 was recorded in Bulgaria. Moreover, there is no connection between spending on general public services and a higher evaluation of government. The results show that countries that spent more on executive and legislative organs, financial and fiscal affairs as well as external affairs had a lower WGI.
In 2014 and 2015 Lithuania, Poland, Bulgaria and Slovakia spent a lower amount per resident than EU 28 on executive and legislative organs, financial and fiscal affairs, as well as external affairs. This was affected by a lower GDP per capita as the countries under analysis could nominally afford less. Yet, the ratios of expenditure to GDP and revenue show that expenditure on this sub-group is higher than EU 28 and might point to possible inefficiency.
Finally, expenditure on general services in Lithuania, Poland, Bulgaria and Slovakia was lower than the EU 28 average in 2014 and 2015, and government spending on R&D general public services was very negligible.
